Coverage ECDF
Coverage refers to the proportion of true values that fall within a given prediction interval. For a well-calibrated model, the coverage should match the intended interval width. For example, a 95% credible interval should contain the true value 95% of the time.
The distribution should be uniform if the model is well-calibrated. To make the plot easier to interpret, we plot the Δ-ECDF, that is, the difference between the expected CDF and the observed ECDF. As small deviations from uniformity are expected, the plot also shows the credible envelope.
We can compute the coverage for equal-tailed intervals (ETI) by passing coverage=true to plot_ecdf_pit. This works because ETI coverage can be obtained by transforming the PIT values. However, for other interval types, such as HDI, coverage must be computed explicitly and is not supported by this function.
using ArviZPythonPlots, ArviZExampleData

use_style("arviz-variat")

data = load_example_data("sbc")
pc = plot_ecdf_pit(data; coverage=true)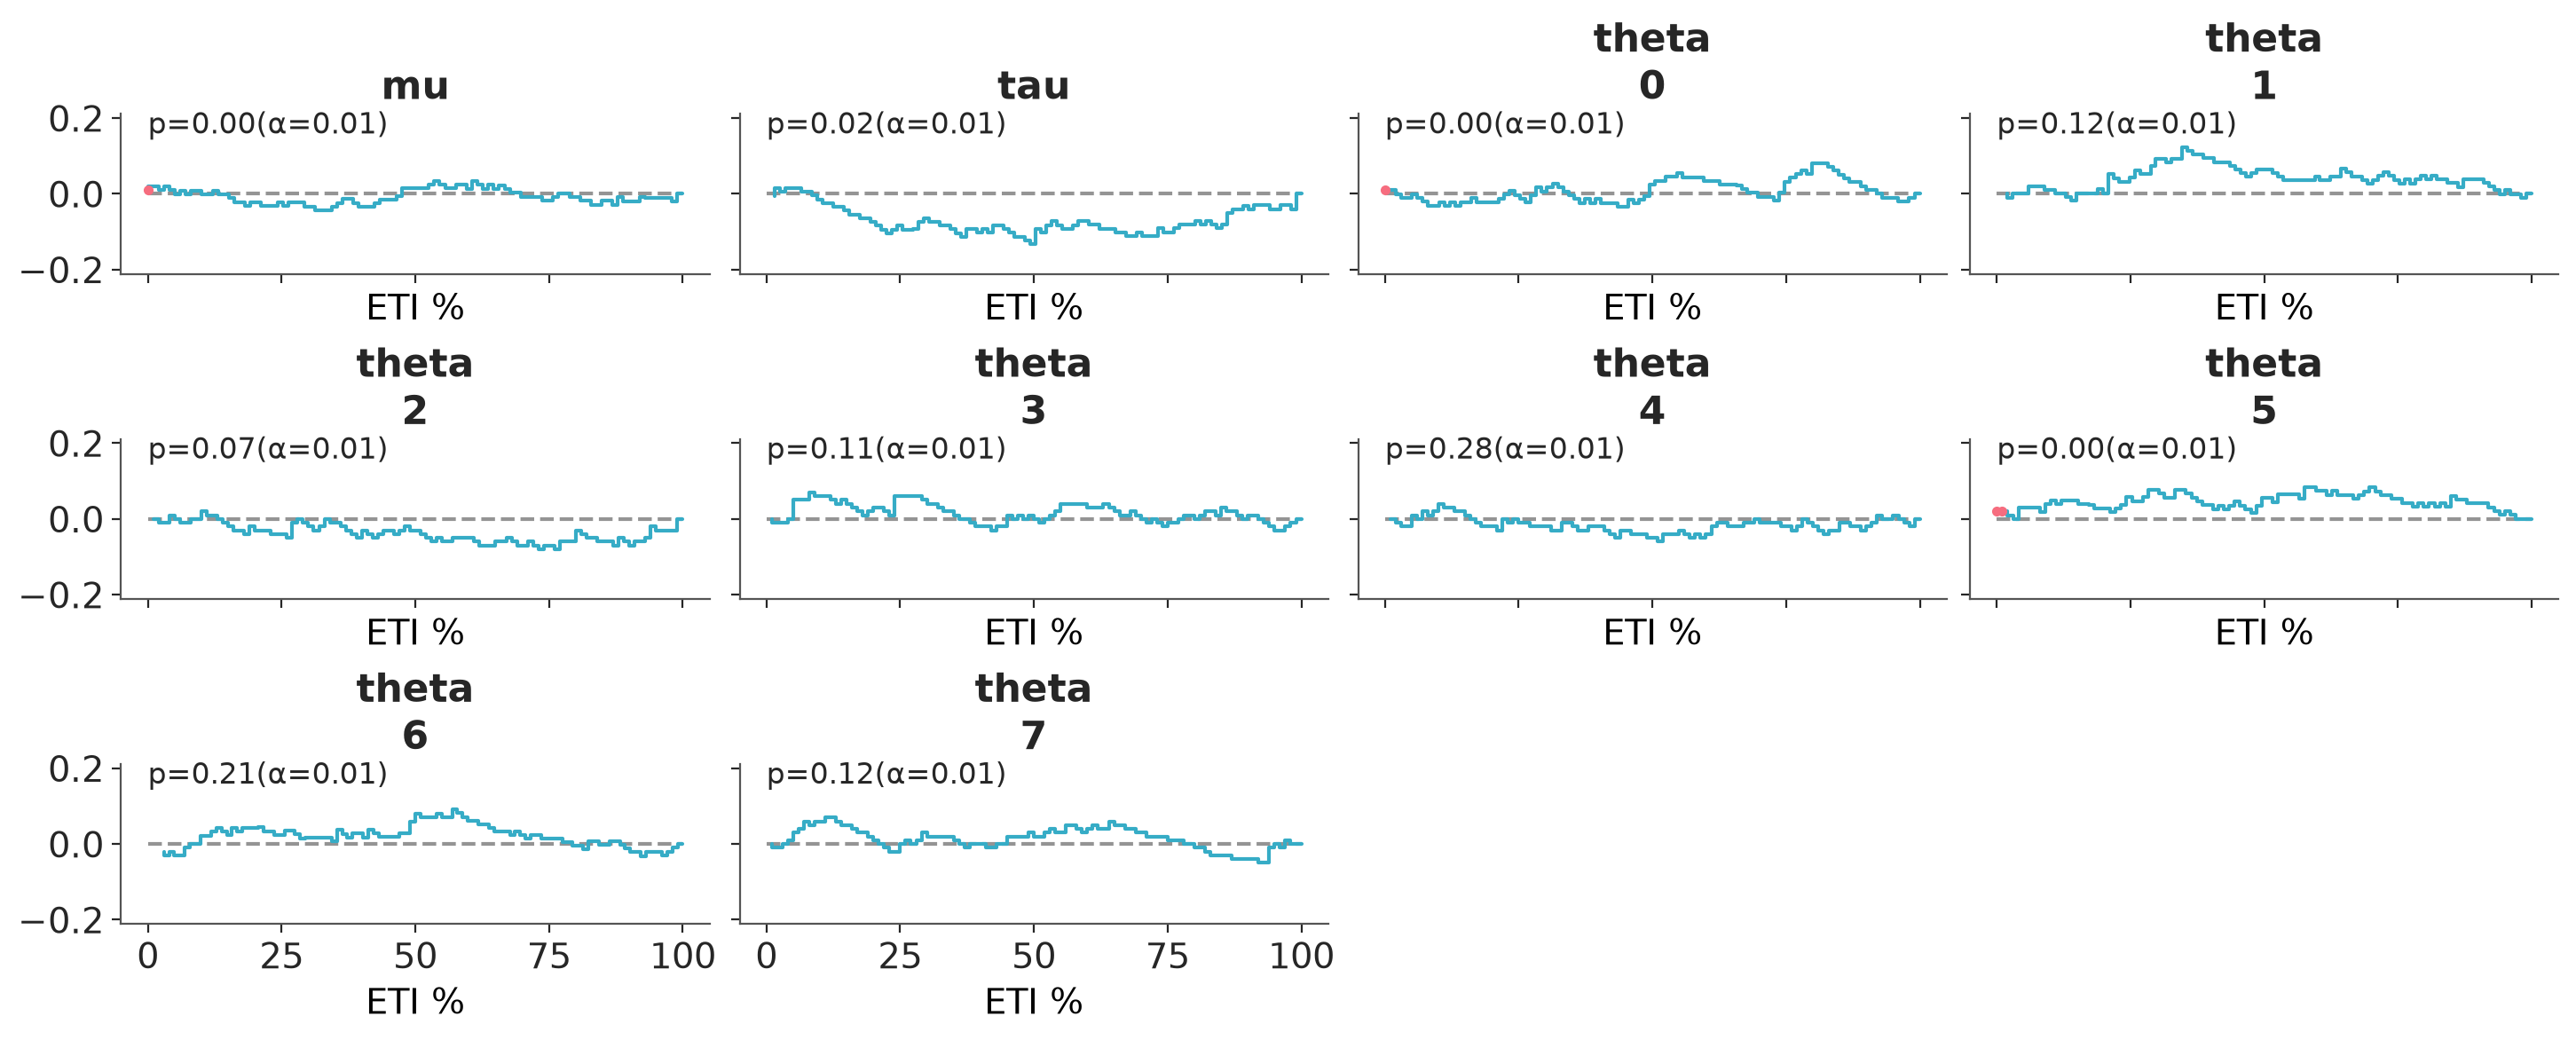
See plot_ecdf_pit.