home
ArviZ
    ArviZPythonPlotsArviZPlots (unregistered)
    PosteriorStatsPSIS
    MCMCDiagnosticTools
    InferenceObjectsArviZExampleDataDimensionalData (external)
    /
    • Home
    • Examples gallery
      • Overview
        • Posterior ECDFs
        • Posterior Histograms
        • Posterior KDEs
        • Posterior quantile dot plots
        • Forest plot
        • Forest plot with shading
        • Plot prior and posterior
        • Scatterplot one variable against all others
        • Scatterplot all variables against each other
        • Ridge plot
        • Diagnostics for density estimation
        • Density and diagnostics for density estimation
        • Posterior KDEs for two models
        • Posterior forest for two models
        • Ridge plot for multiple models
        • Rank plot
        • Trace plot
        • ESS evolution
        • ESS local
        • ESS quantile
        • ESS comparison
        • Monte Carlo standard error
        • Convergence diagnostics distribution
        • Autocorrelation Plot
        • Energy
        • Scatter plot of one variable against all other variables with divergences
        • Scatter plot of all variables against each other with divergences
        • Parallel coordinates plot
        • Linear model plot
        • Predictive check with KDEs
        • Rootogram
        • PAV-adjusted calibration
        • PIT ECDF
        • Coverage ECDF
        • LOO-PIT ECDF
        • Test statistics
        • Interval plot
        • Survival analysis (censored data)
        • PAV-adjusted residual plot
        • Interval plot (LOO)
        • Predictive check with ECDF and PIT Δ-ECDFs
        • Sensitivity posterior marginals
        • Sensitivity posterior quantities
        • Predictive model comparison
        • Pareto k parameter diagnostics
        • Bayes factor
        • PIT-ECDF
        • Coverage ECDF
        • Rank and distribution plot
        • Trace and distribution plot
        • Custom diagnostic plots combination
    • API
      • Input conversions
      • Plotting styles
      • rcParams
      • Plotting functions
    Version
    • Examples gallery
    • Distribution
    • Posterior ECDFs
    • Posterior ECDFs
    GitHub

    Posterior ECDFs

    Faceted ECDF plots for 1D marginals of the distribution.

    using ArviZPythonPlots, ArviZExampleData
    
    use_style("arviz-variat")
    
    data = load_example_data("centered_eight")
    pc = plot_dist(data; kind="ecdf", col_wrap=4)
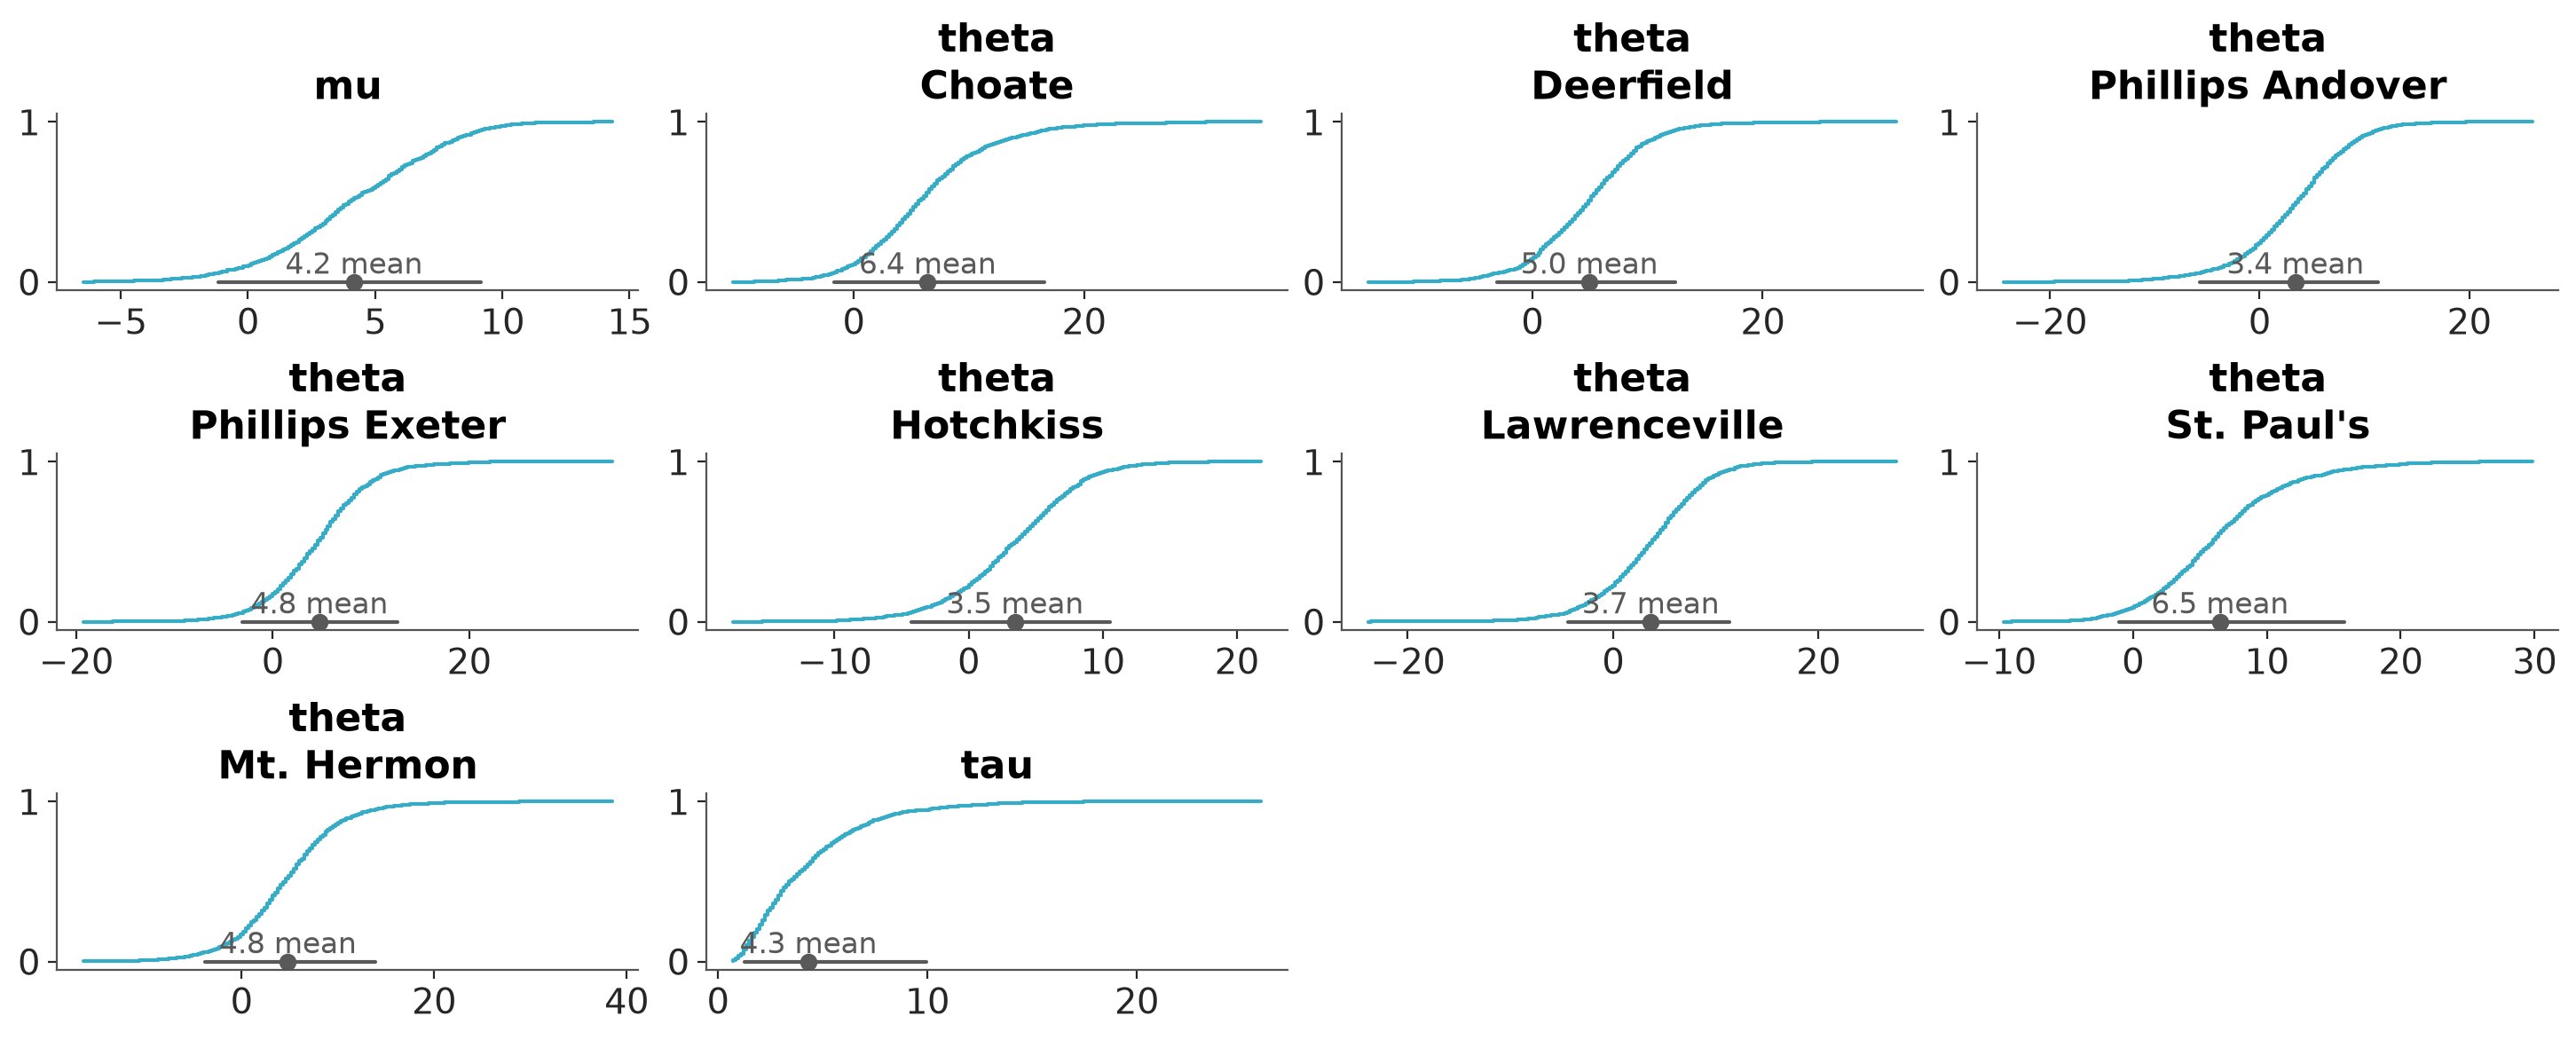
    Example block output

    See plot_dist.

    See also the EABM chapter on Visualization of Random Variables with ArviZ.

    « OverviewPosterior Histograms »

    Powered by Documenter.jl and the Julia Programming Language.

    Settings


    This document was generated with Documenter.jl version 1.17.0 on Tuesday 7 July 2026. Using Julia version 1.12.6.