Interval plot
Plot posterior predictive point estimate and intervals at each observation.
using ArviZPythonPlots, ArviZExampleData, DimensionalData, InferenceObjects

use_style("arviz-variat")

data = load_example_data("radon")
obs_id_subset = At(0:49)
data_subset = InferenceData(;
    posterior_predictive=data.posterior_predictive[obs_id = obs_id_subset],
    observed_data=data.observed_data[obs_id = obs_id_subset],
)

pc = plot_ppc_interval(data_subset)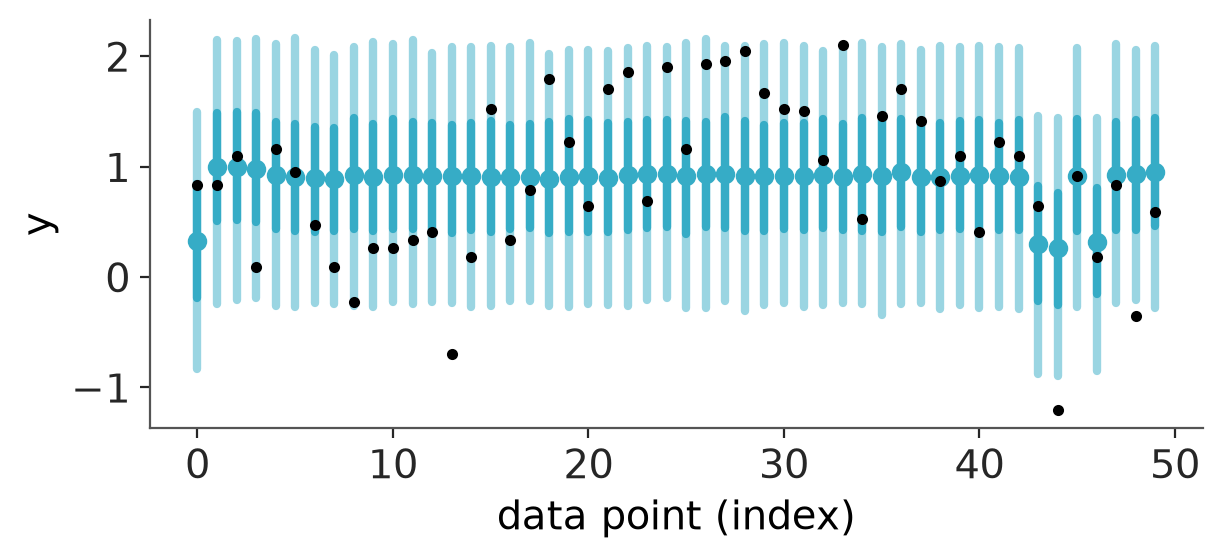
See plot_ppc_interval.