Trace and distribution plot
Two column layout with marginal distributions on the left and MCMC traces on the right.
using ArviZPythonPlots, ArviZExampleData

use_style("arviz-variat")

data = load_example_data("non_centered_eight")
pc = plot_trace_dist(data)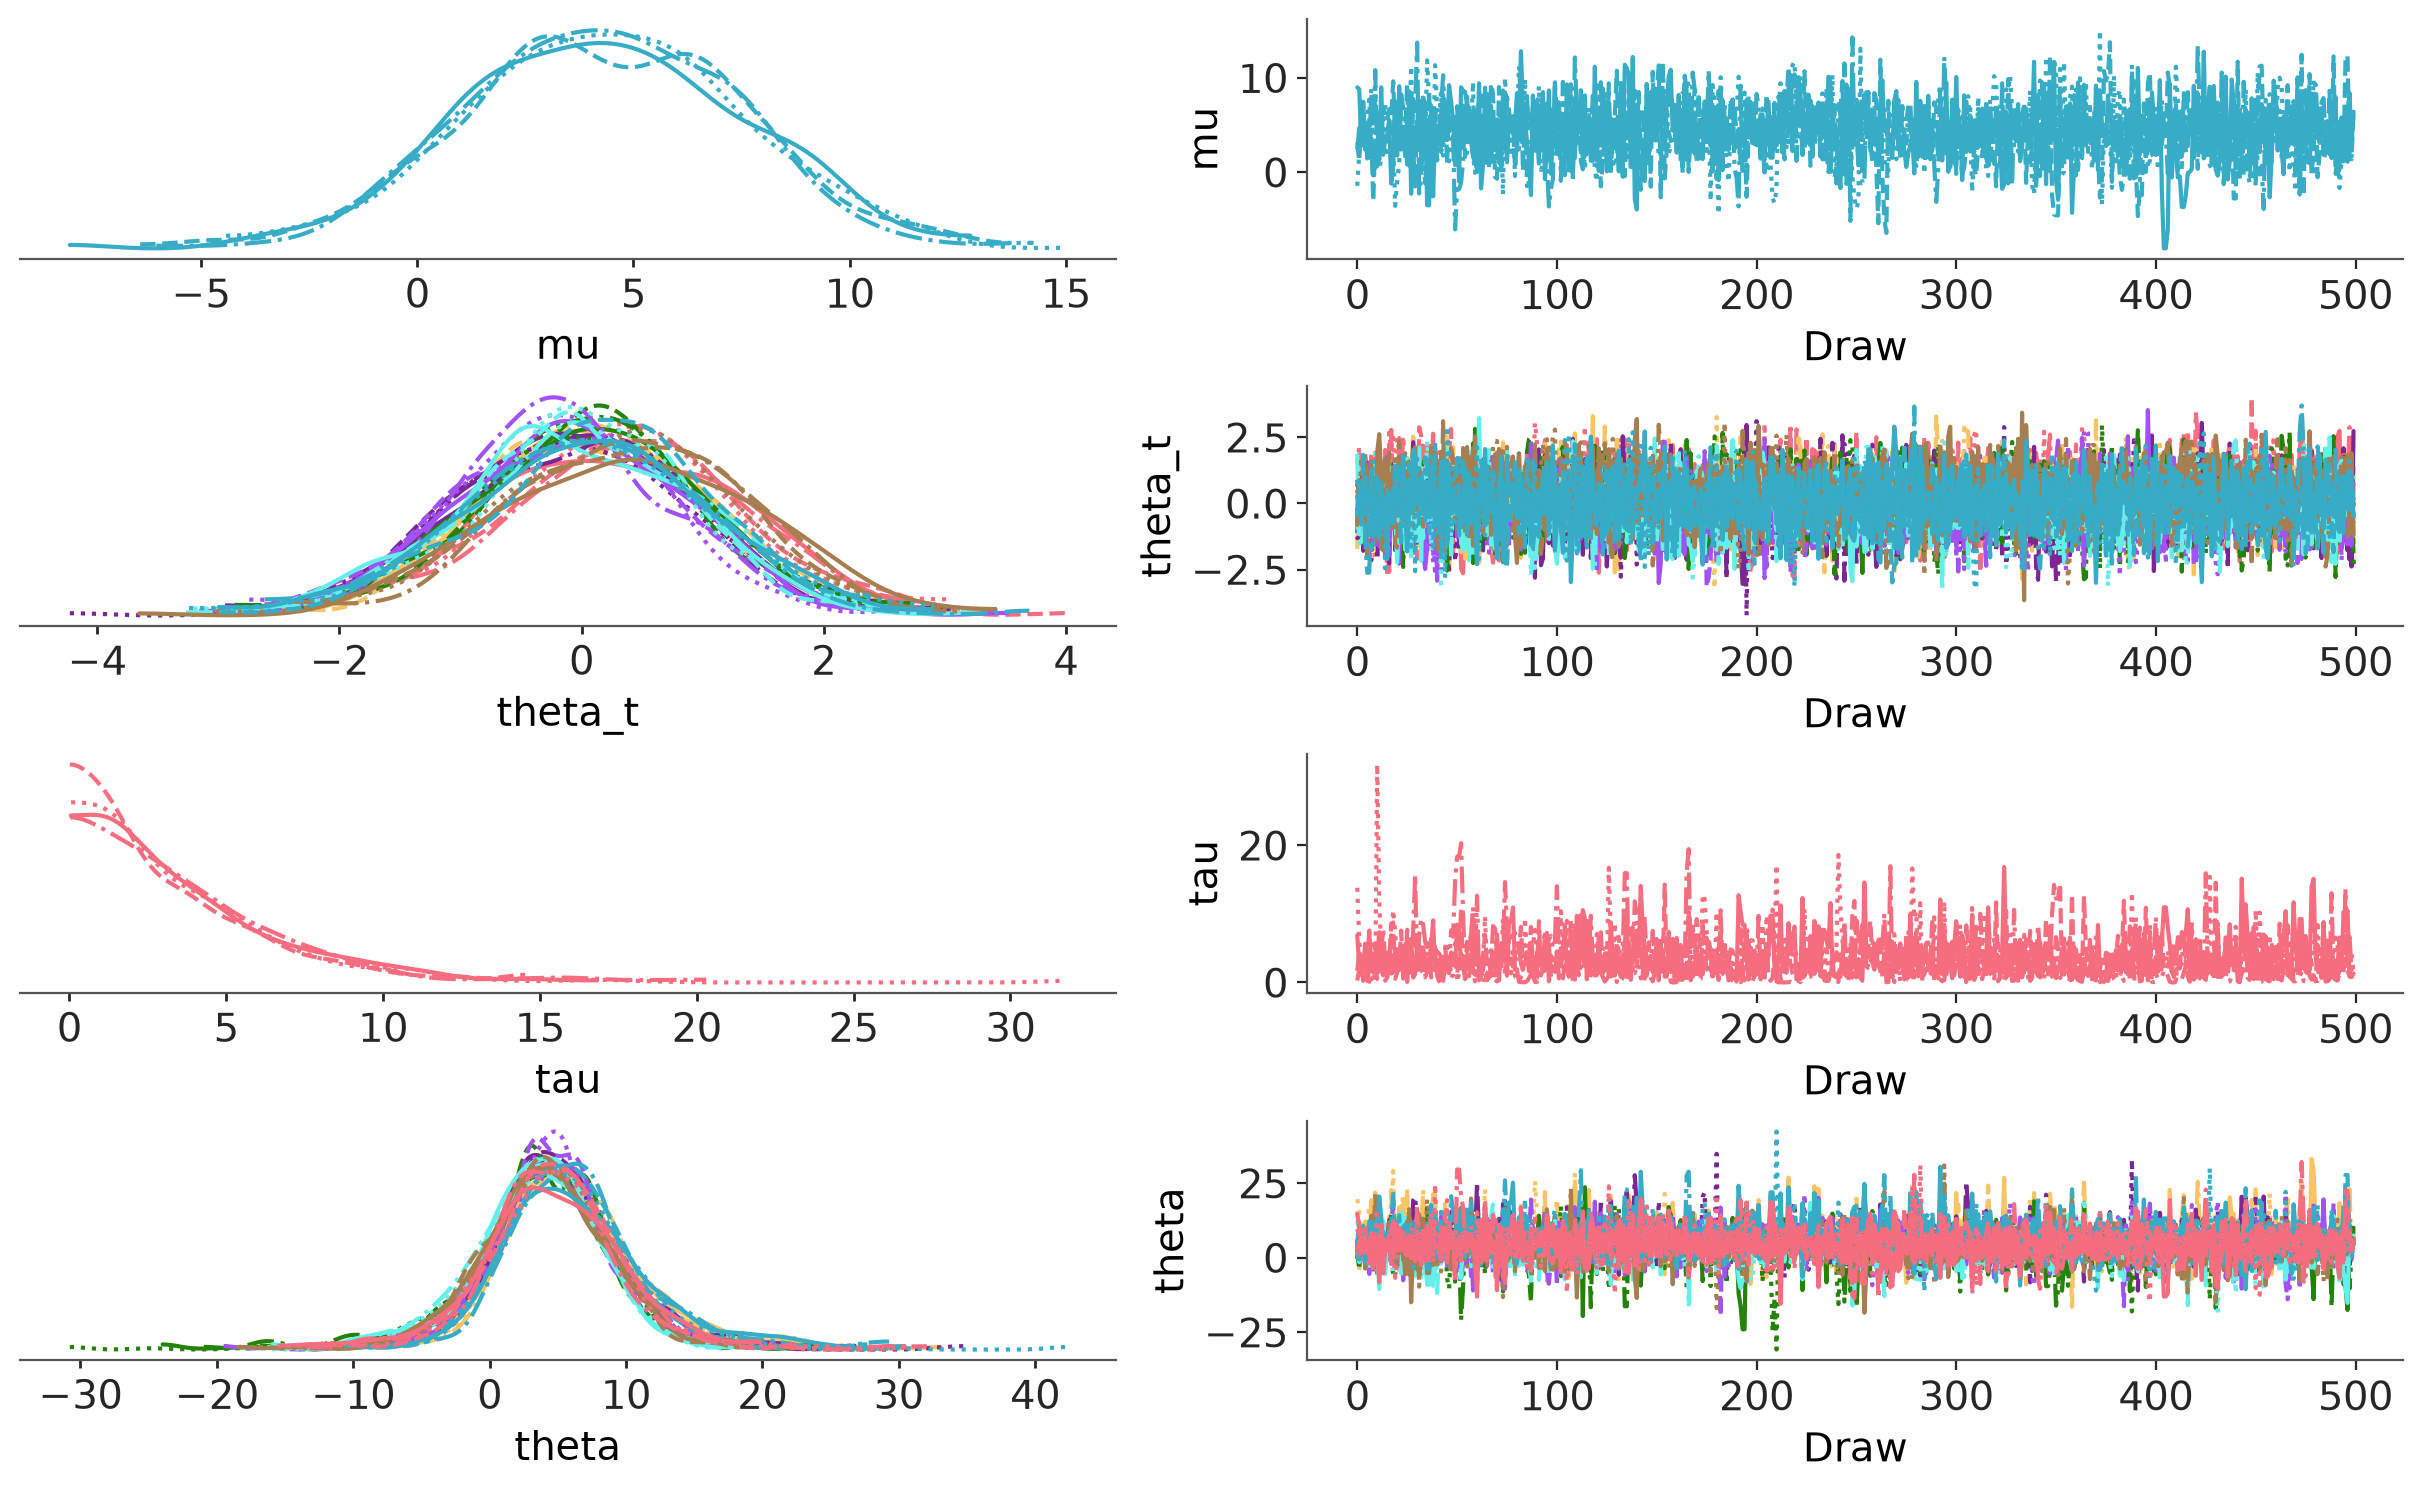
See plot_trace_dist.