Sensitivity posterior marginals
The posterior sensitivity is assessed by power-scaling the prior or likelihood and visualizing the resulting changes. Sensitivity can then be quantified by considering how much the perturbed posteriors differ from the base posterior.
using ArviZPythonPlots, ArviZExampleData, InferenceObjects

use_style("arviz-variat")

idata = load_example_data("rugby")
# the power-scaling sensitivity diagnostic needs every log_likelihood variable to share the
# sample dimensions, so drop the home_team/away_team string covariates that live there too
log_likelihood = idata.log_likelihood[(:home_points, :away_points)]
idata = merge(idata, InferenceData(; log_likelihood))

pc = plot_psense_dist(
    idata;
    var_names=["defs", "sd_att", "sd_def"],
    coords=Dict("team" => ["Scotland", "Wales"]),
    y=[-2, -1, 0],
)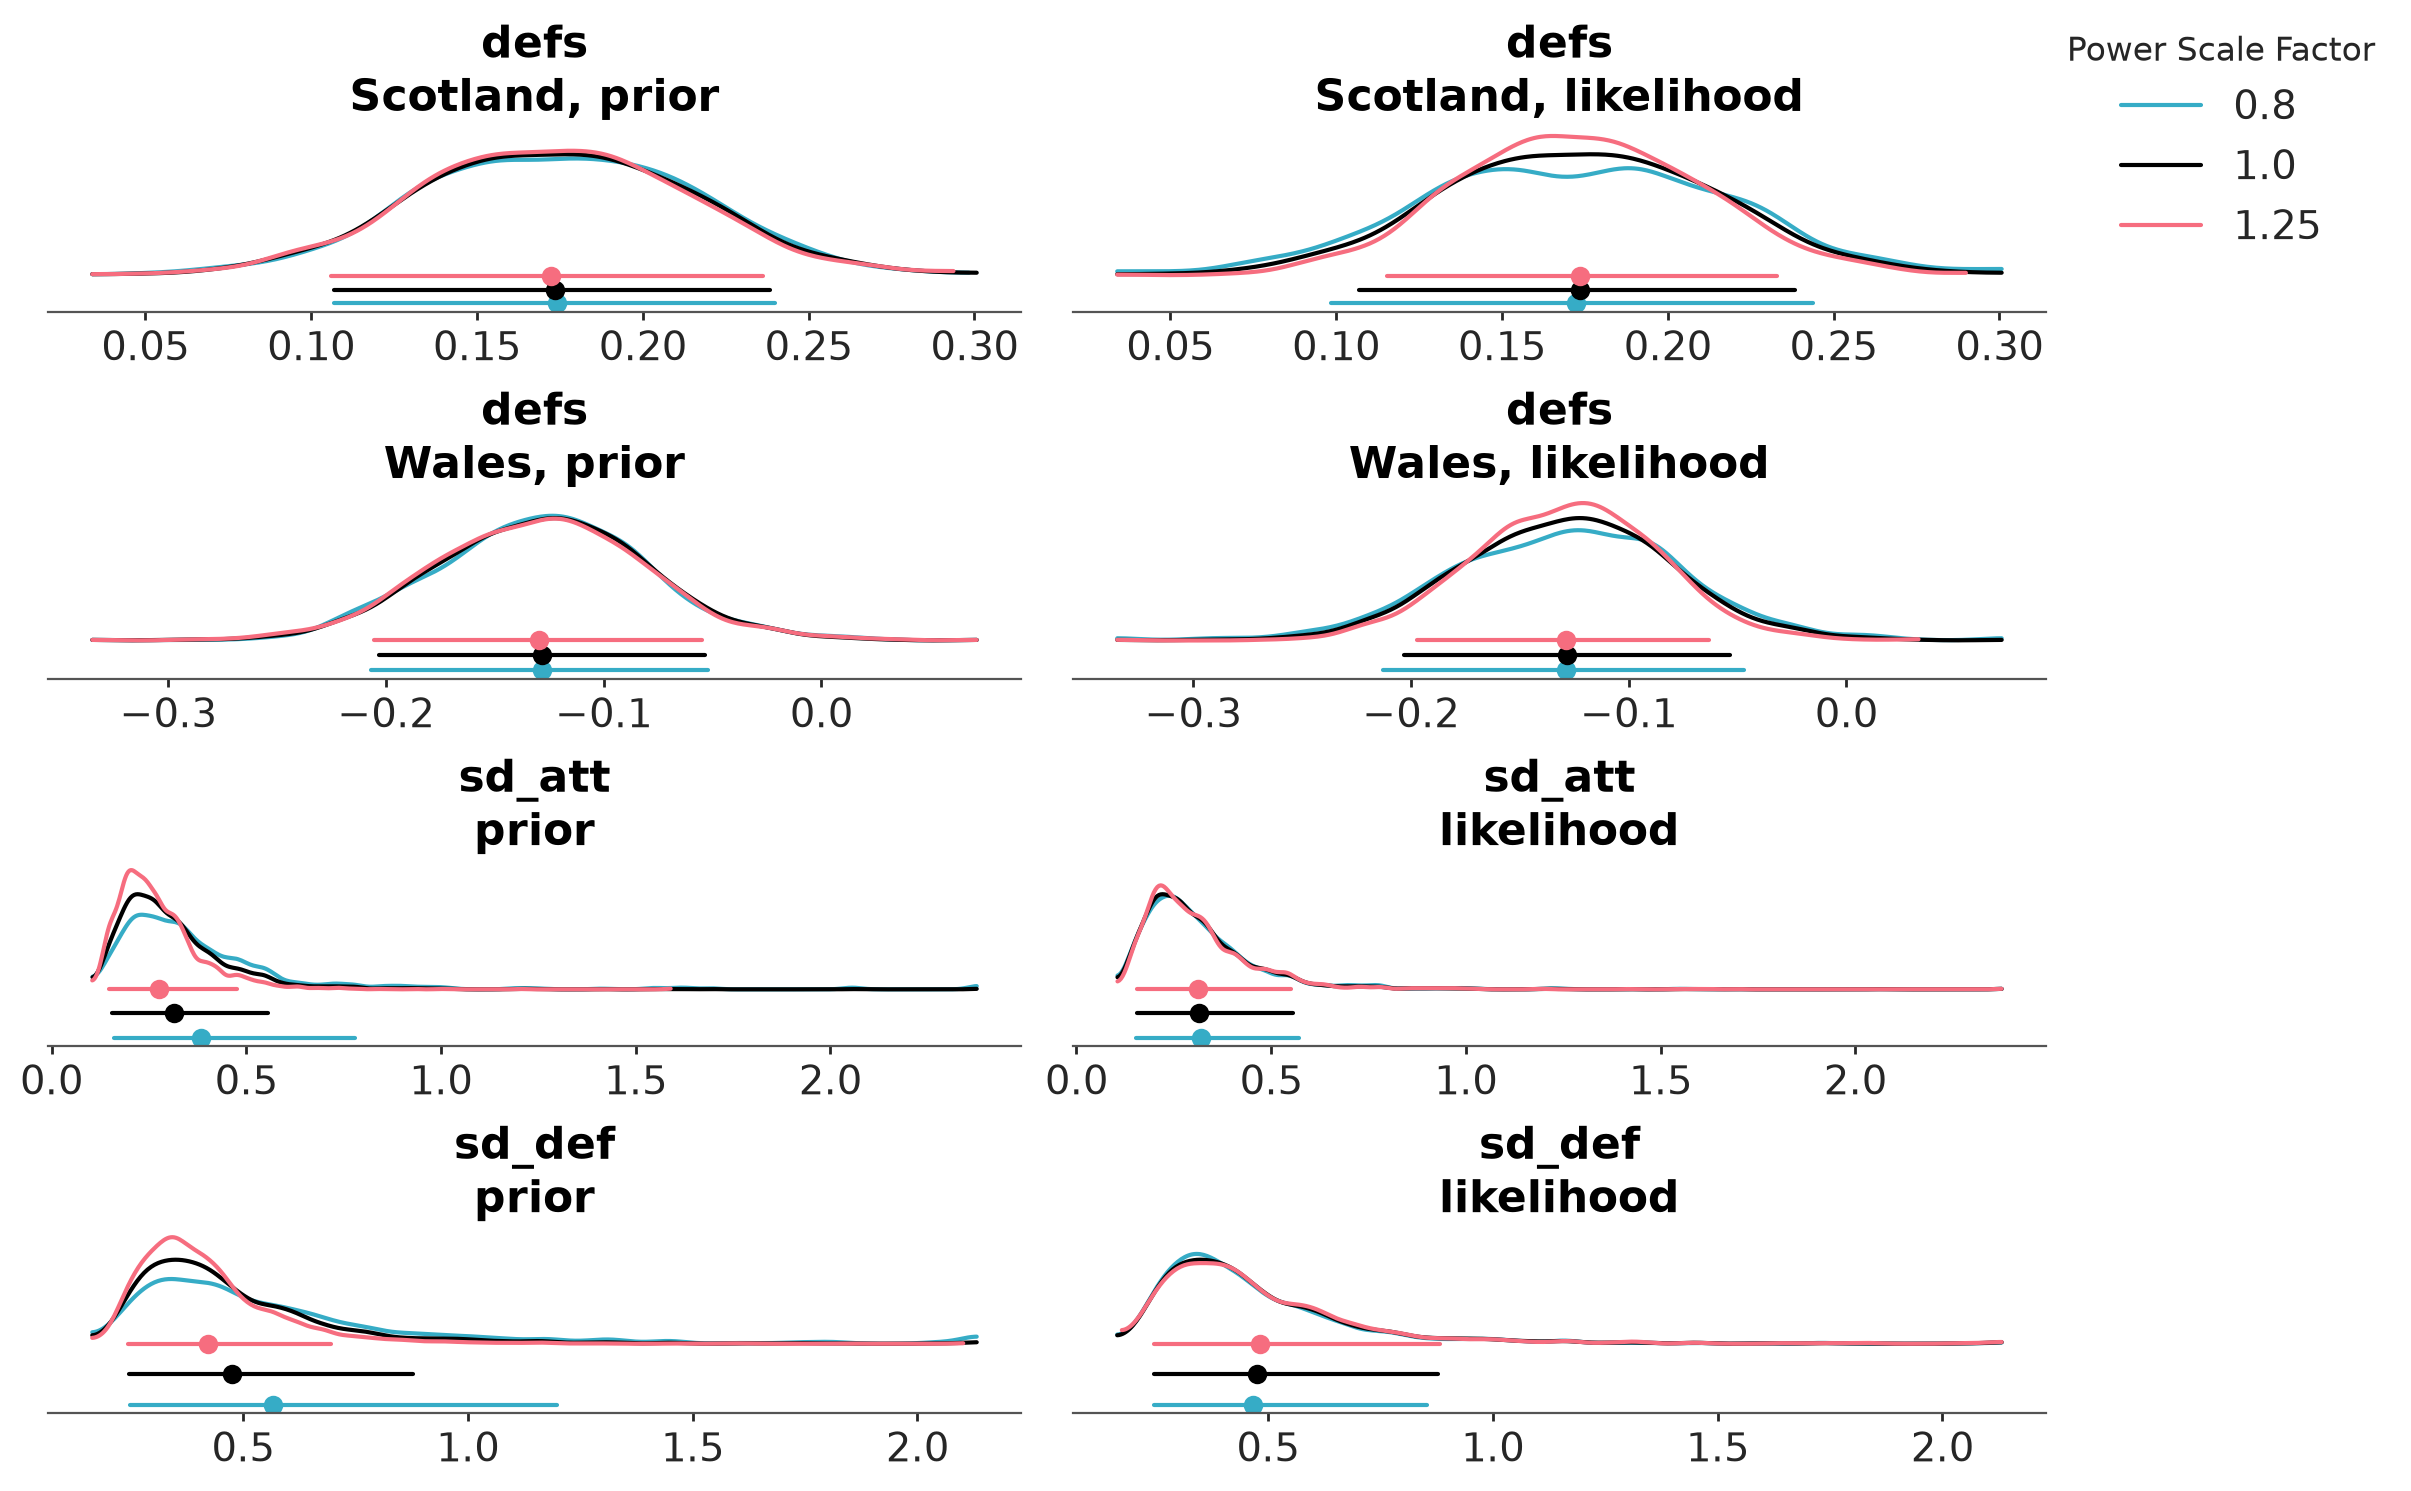
See plot_psense_dist.