Posterior quantile dot plots
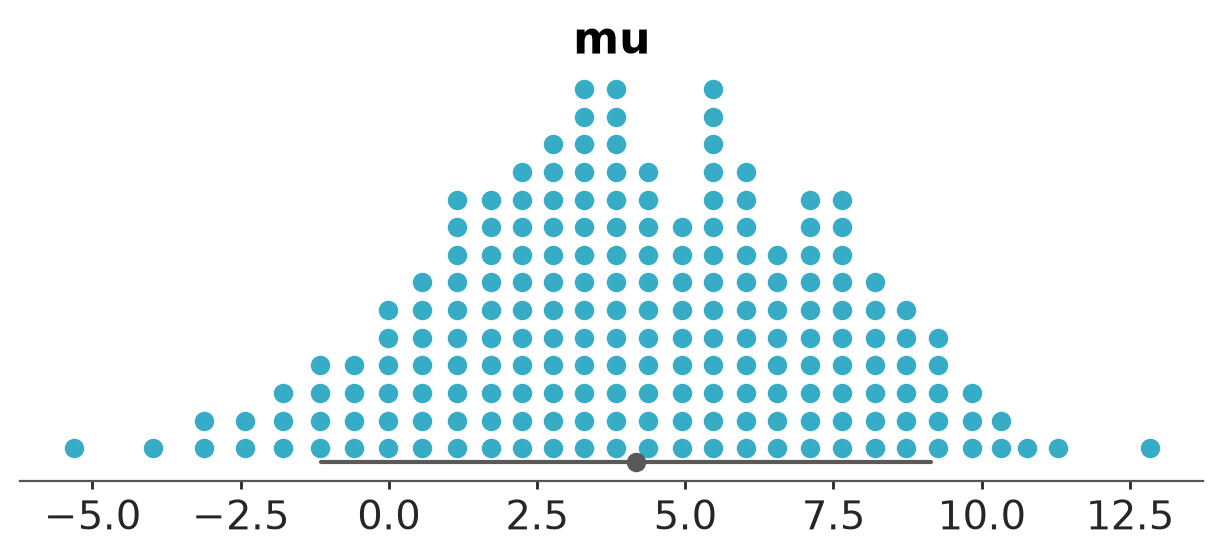
Quantile dot plot of the variable mu from the centered eight model. The point estimate text is removed and the number of quantiles is changed to 200.
using ArviZPythonPlots, ArviZExampleData

use_style("arviz-variat")

data = load_example_data("centered_eight")
pc = plot_dist(
    data;
    kind="dot",
    var_names=["mu"],
    visuals=Dict("point_estimate_text" => false),
    stats=Dict("dist" => Dict("nquantiles" => 200)),
)
See plot_dist.
See also the EABM chapter on Visualization of Random Variables with ArviZ.