Ridge plot for multiple models
Visual representation of marginal distributions over the y axis for multiple models.
using ArviZPythonPlots, ArviZExampleData

use_style("arviz-variat")

centered = load_example_data("centered_eight")
non_centered = load_example_data("non_centered_eight")

pc = plot_ridge(
    Dict("centered" => centered, "non-centered" => non_centered);
    coords=Dict("school" => ["Deerfield", "St. Paul's", "Hotchkiss"]),
)
pc.add_legend("model")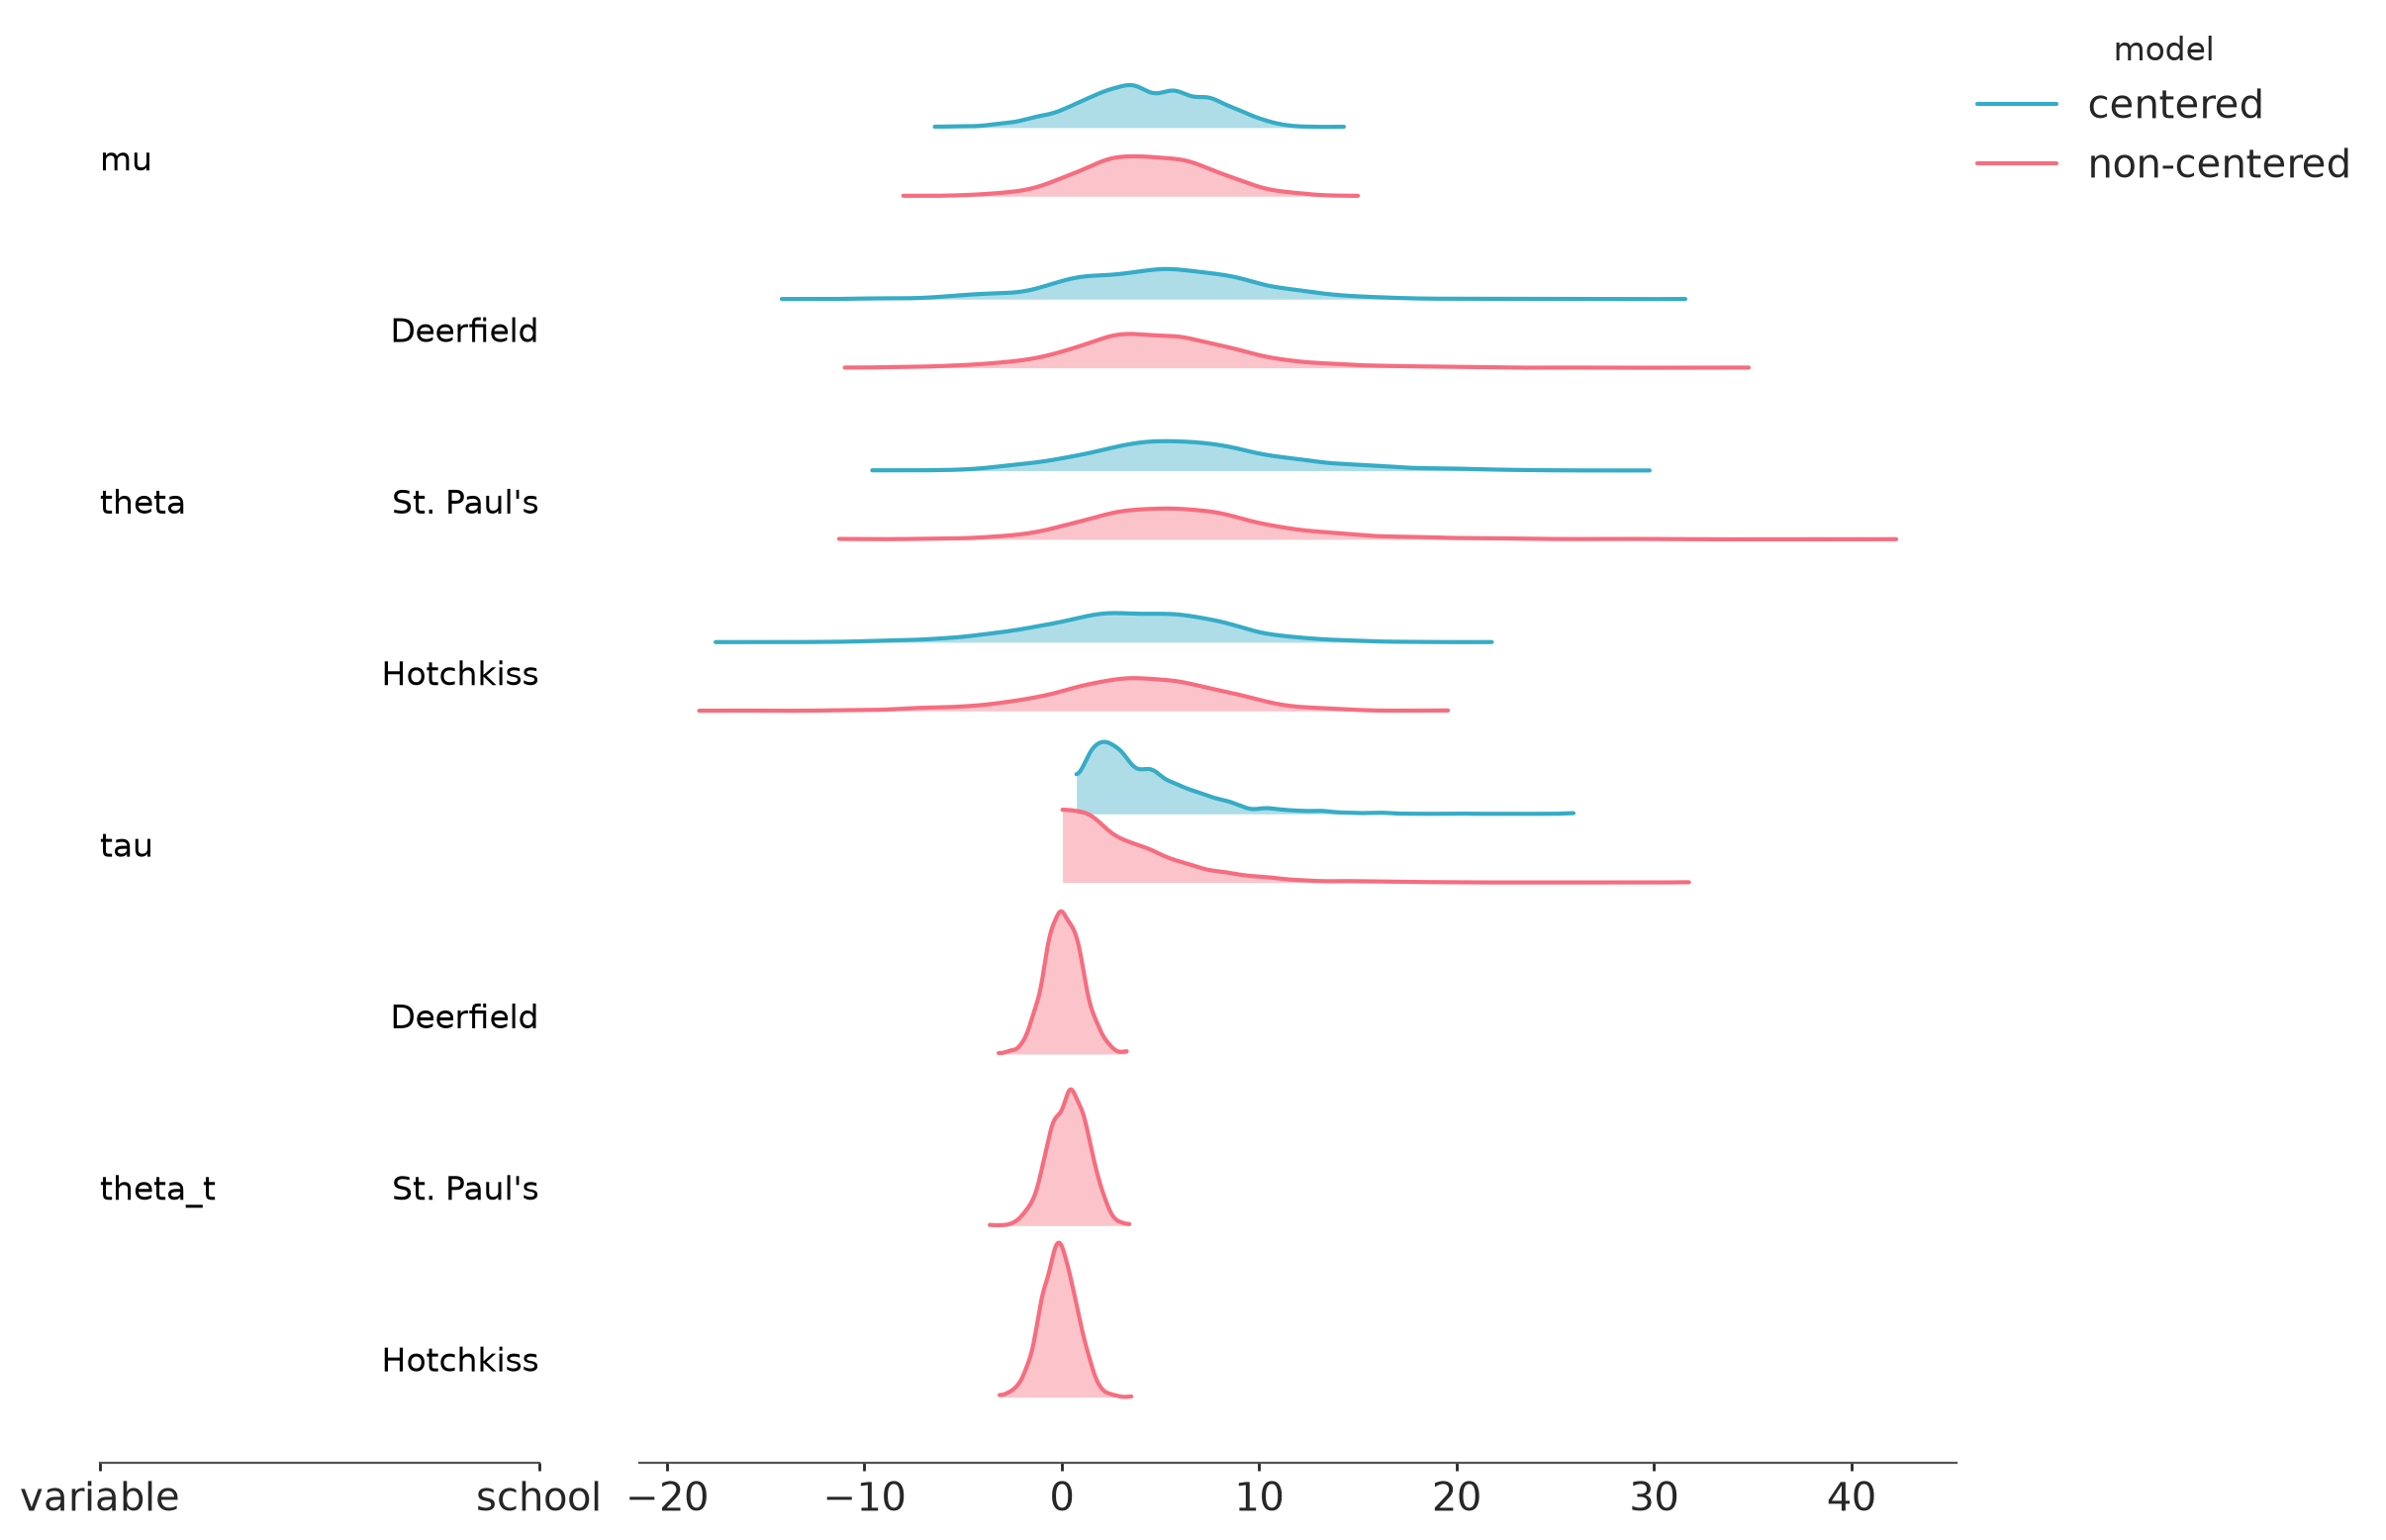
See plot_ridge.