Survival analysis (censored data)
Plot Kaplan-Meier survival curve vs posterior predictive draws.
using ArviZPythonPlots, ArviZExampleData

use_style("arviz-variat")

data = load_example_data("censored_cats")
pc = plot_ppc_censored(data; extrapolation_factor=nothing)
pc.facet_map("set_xscale"; scale="sqrt")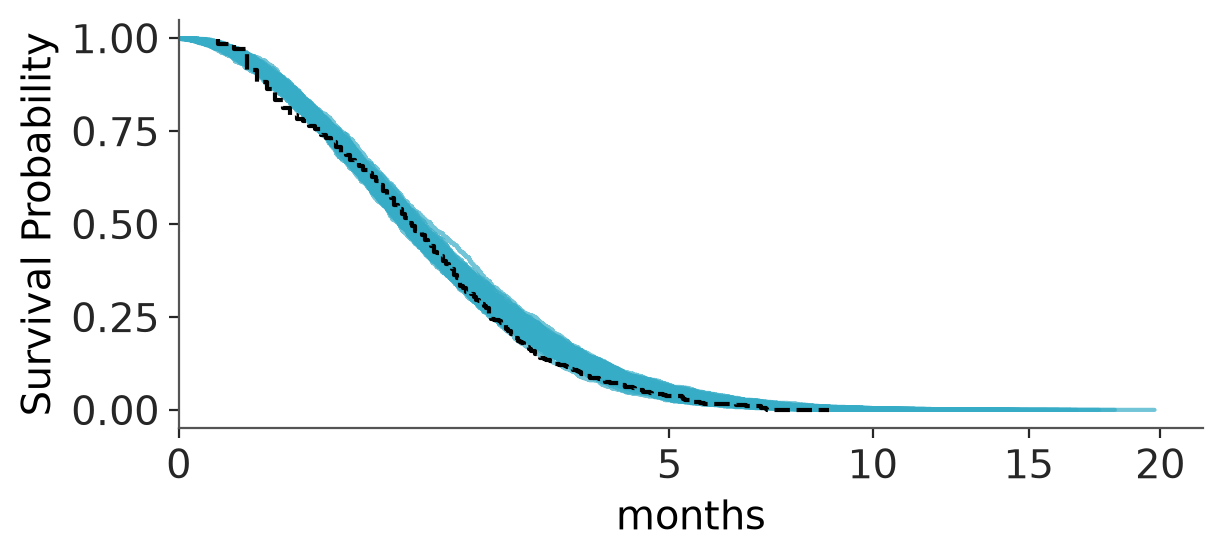
See plot_ppc_censored.