PIT-ECDF
Faceted plot with PIT Δ-ECDF values for each variable.
plot_ecdf_pit assumes the values passed to it have already been transformed to PIT values, as in the case of SBC analysis or values from arviz_base.loo_pit.
The distribution should be uniform if the model is well-calibrated. To make the plot easier to interpret, we plot the Δ-ECDF, that is, the difference between the expected CDF and the observed ECDF. As small deviations from uniformity are expected, the plot also shows the credible envelope.
using ArviZPythonPlots, ArviZExampleData

use_style("arviz-variat")

data = load_example_data("sbc")
pc = plot_ecdf_pit(data)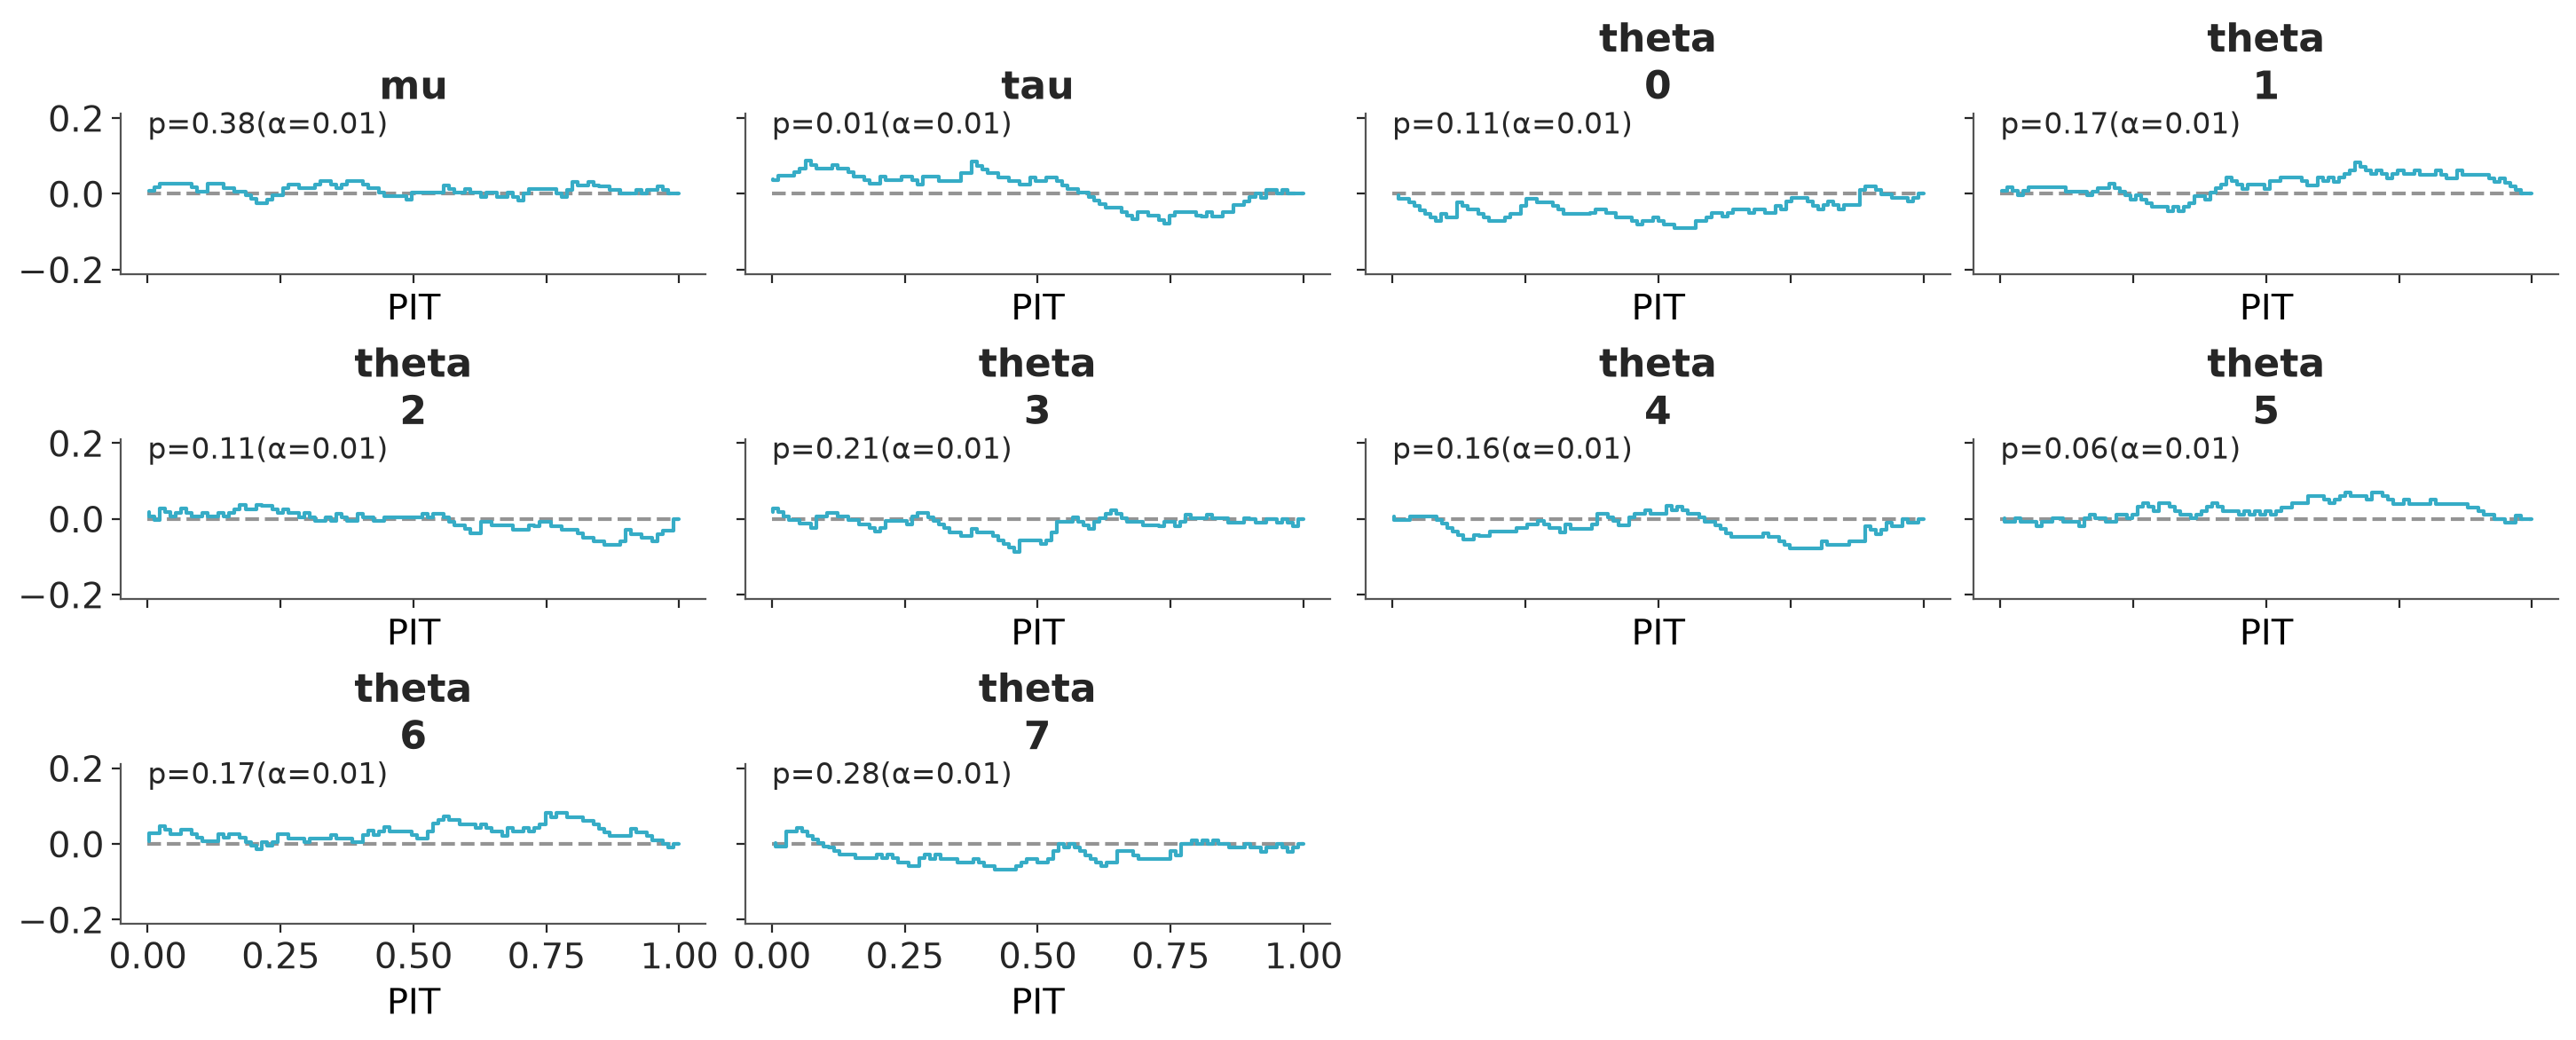
See plot_ecdf_pit.