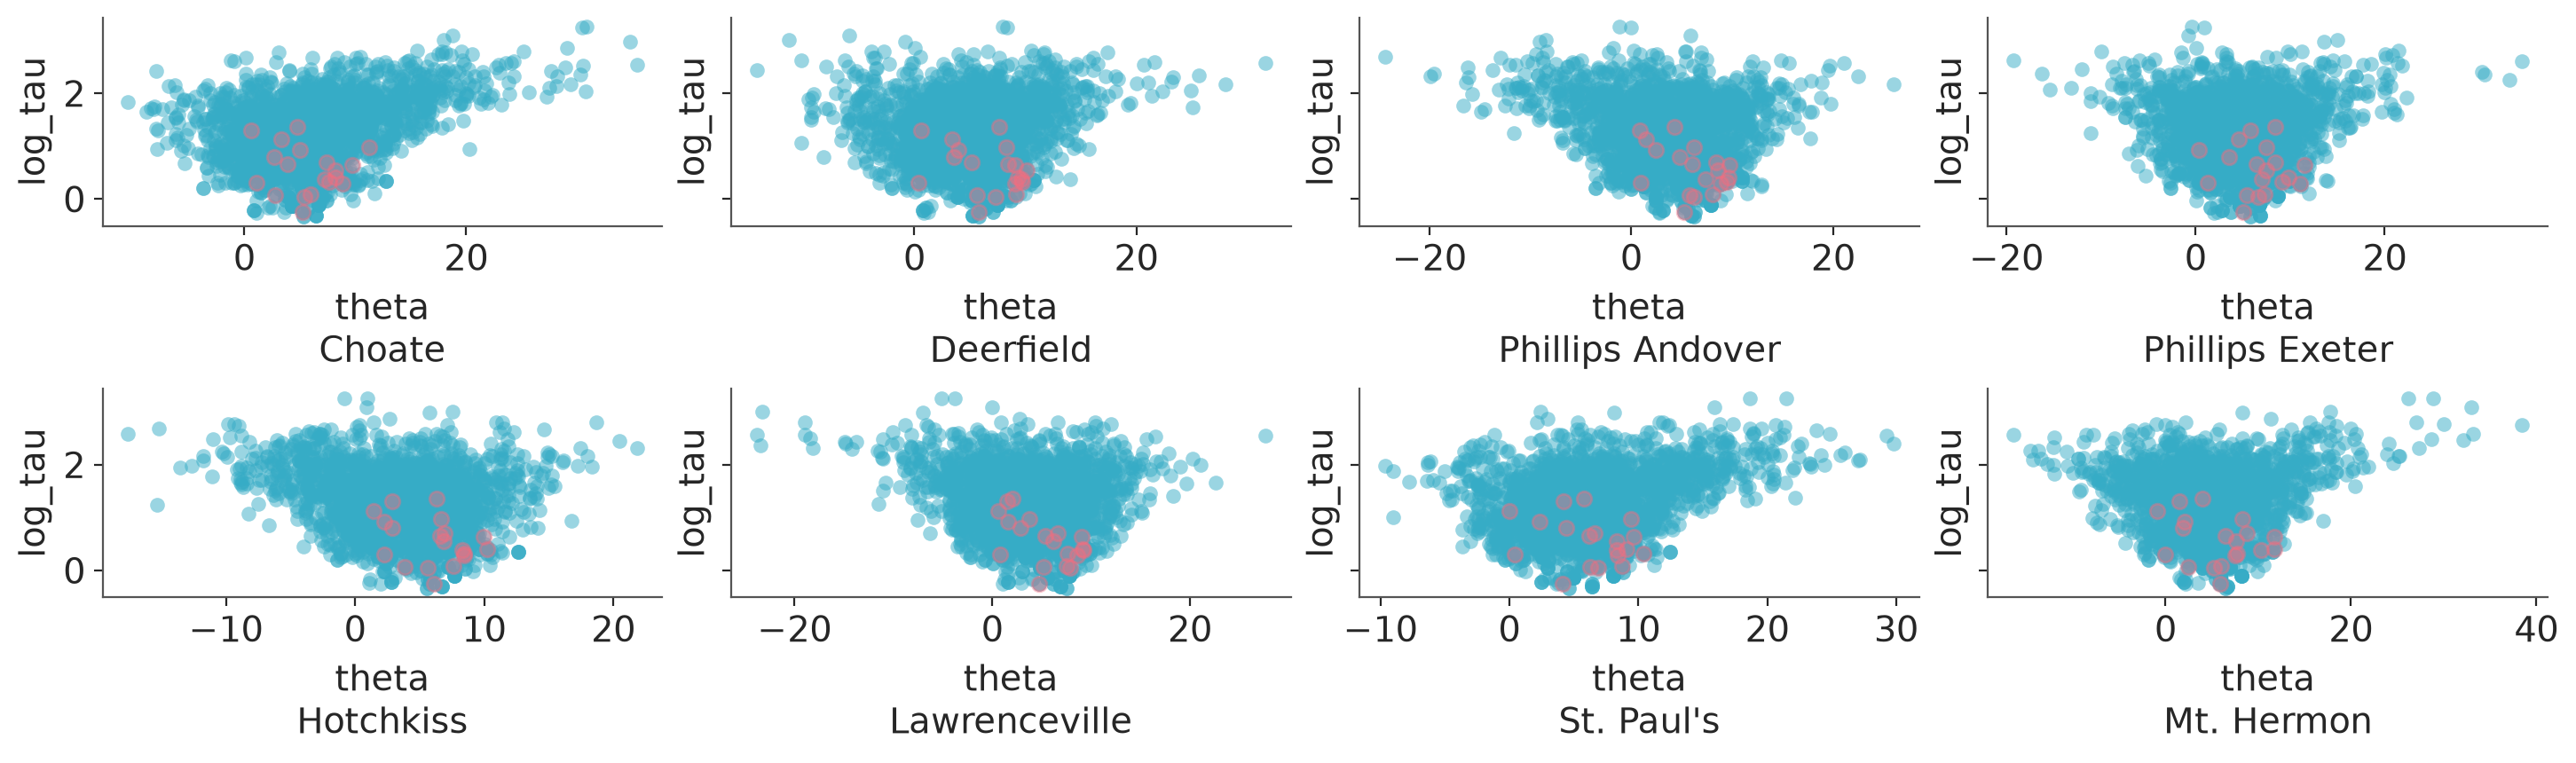
Scatter plot of one variable against all other variables with divergences
Plot one variable against other variables in the dataset.
using ArviZPythonPlots, ArviZExampleData, InferenceObjects

use_style("arviz-variat")

data = load_example_data("centered_eight")
posterior = merge(data.posterior, Dataset((; log_tau=log.(data.posterior.tau))))
data = merge(data, InferenceData(; posterior))

pc = plot_pair_focus(
    data, "log_tau"; var_names=["theta"], visuals=Dict("divergence" => true)
)
See plot_pair_focus.