Posterior Histograms
Faceted histogram plots for 1D marginals of the distribution. The point_estimate_text option is set to false to omit that visual from the plot.
using ArviZPythonPlots, ArviZExampleData

use_style("arviz-variat")

data = load_example_data("centered_eight")
pc = plot_dist(data; kind="hist", visuals=Dict("point_estimate_text" => false))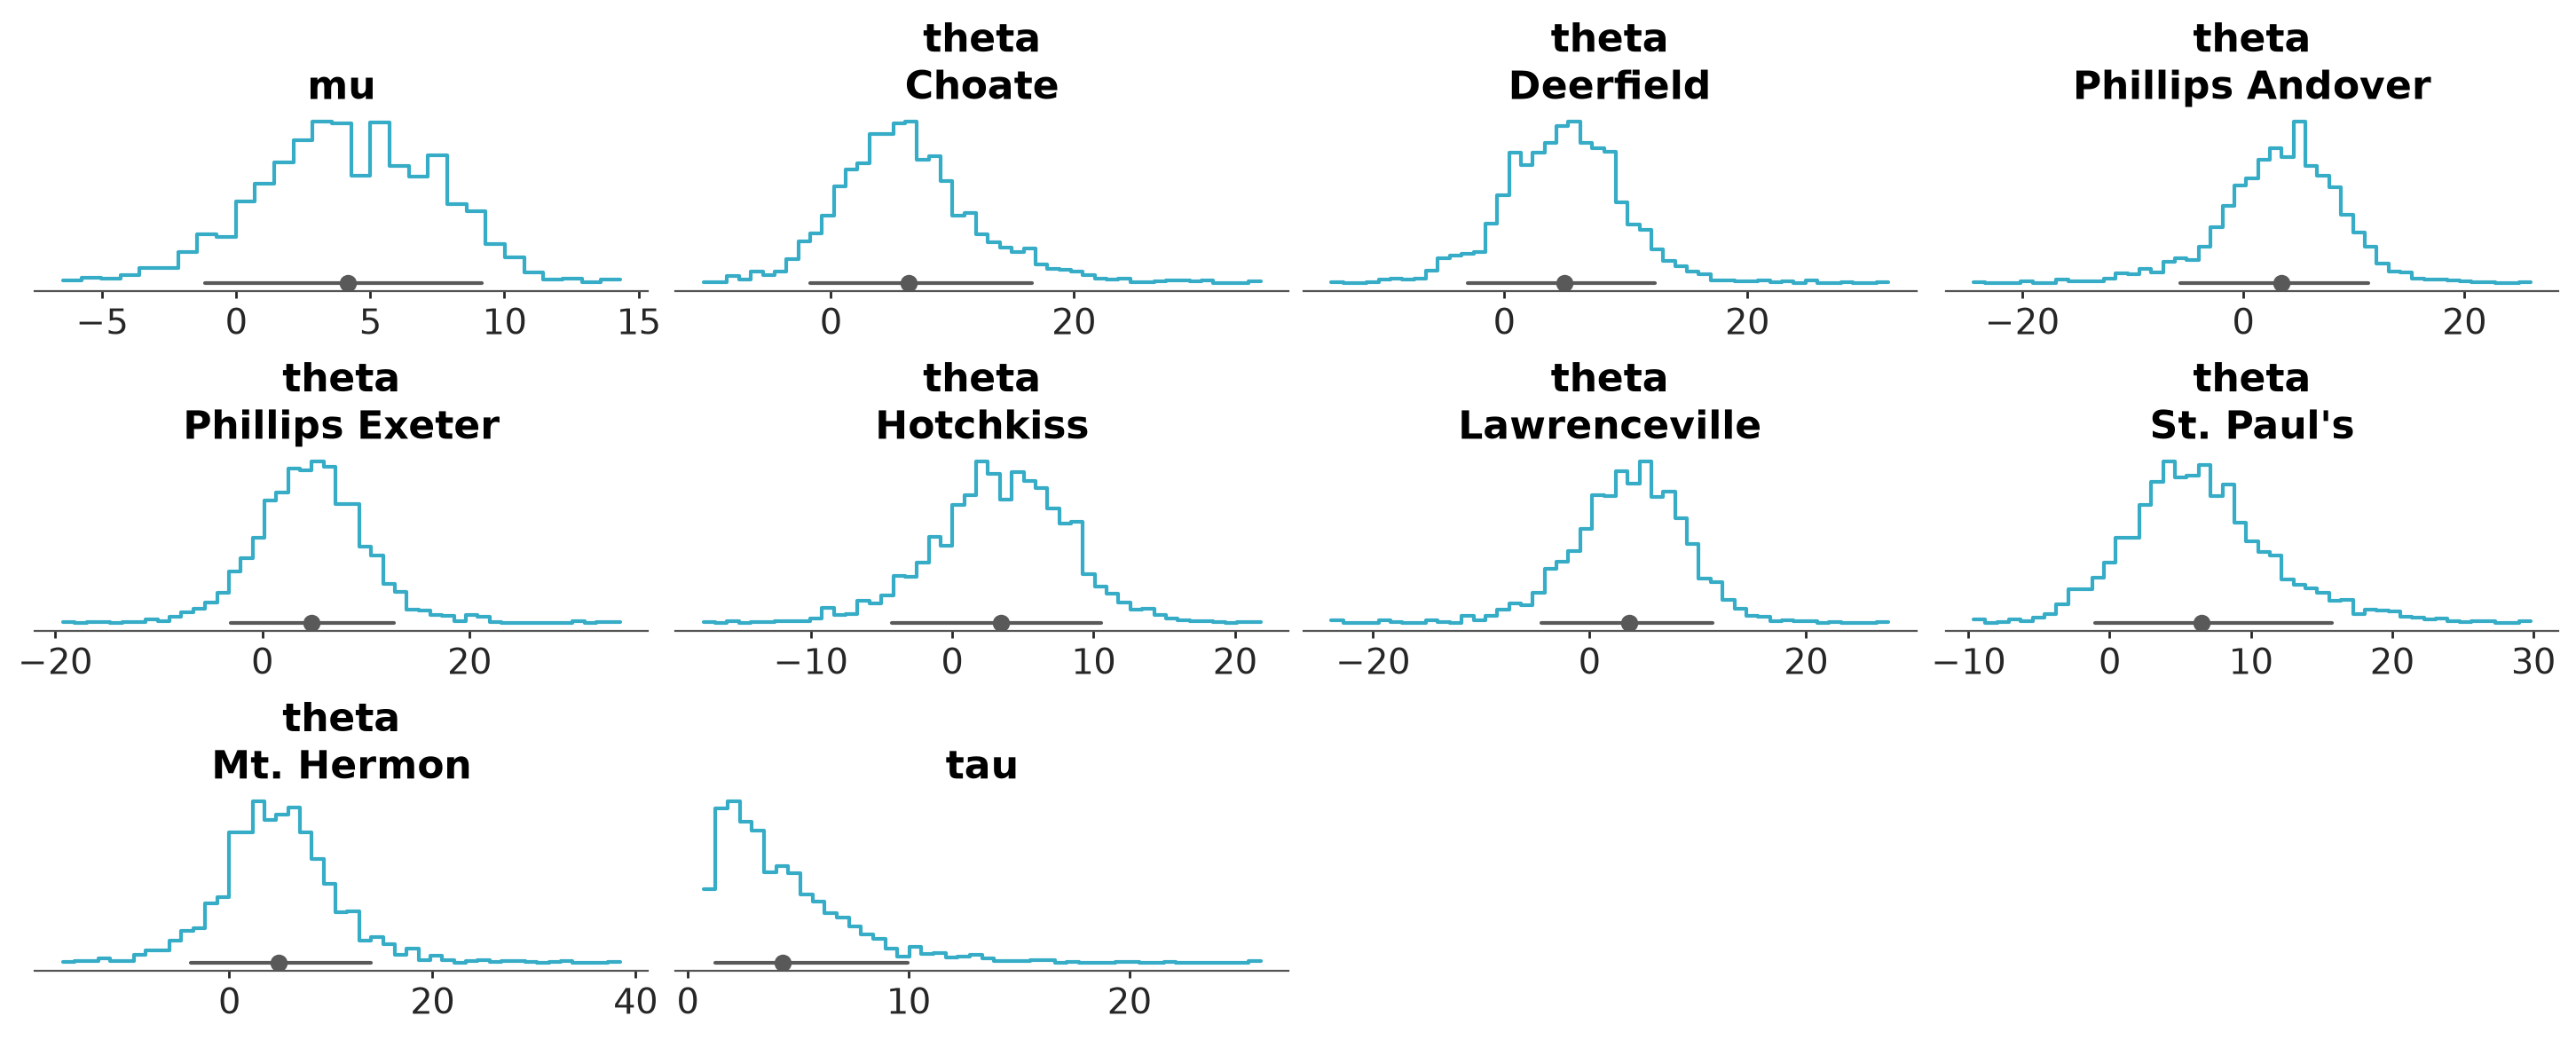
See plot_dist.
See also the EABM chapter on Visualization of Random Variables with ArviZ.